Segments Display
After the Segmentation Process, we have these files:
The Segments display, for a single segmentation
The summary of a set of segmentations
Segments display
This display applies to the .seg (Segments) files. It is exactly the same as the EEG display , with just a few more options.
Menus
Options
Technical points
Full file content
Segments display - Menus
Quite the same as the EEG Menus, with the following variations or additions:
Options menu
-
No: No filling, just plain tracks.
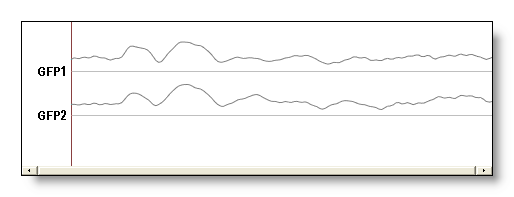
-
Empty: The colors are replaced by an empty color (usually white), and the segments are separated by black lines (useful if you want to apply your own colors, or give it to your little nephew so you have 5 minutes of silence).
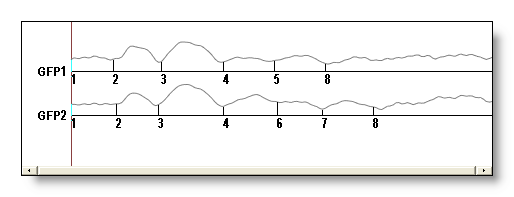
-
Colored: The default colored display. Note that the colors picked depend on the number of segments, so the color for segment 3 will differ if it belongs to different segmentations.
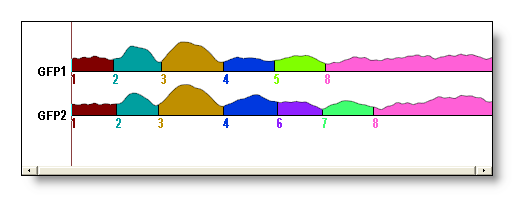
You can change the coloring scheme to these modes:
You can restrict which segments will be actually colored, to focus the display on the segments of interest. Just give the list of segments you want to see, or empty to reset.
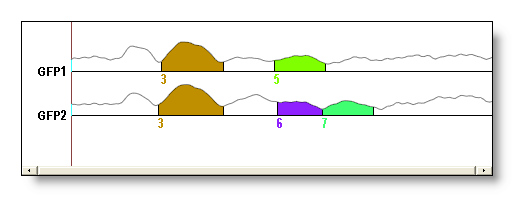
Select Segments from cursor position
This will automatically select the only segments that overlap the current cursor position.
Segments display - Technical points
Full file content
Actually, the .seg file contains more informations than just the colored segments. When the file opens in Cartool, they are not shown to make the display clearer. To see all these informations, simply click on More Tracks button, from the EEG display.
These informations can also be retrieved for some processings of your own...
For each of the file that has been segmented, you have the following informations (in this order):
-
The GFP of the file
-
The Dissimilarity
of the file
-
The segment's labeling
code assigned at each time frame
-
The Global Explained Variance
(of the whole segment)
- The Correlation between the template map and the actual data
See an example, for two conditions, of the restricted initial display, and the full display. Note that the original file names are lost ("Condition1", "Control" f.ex.), so you have to remember the order in which you inputed the data to the segmentation process. GFP1, Dis1, Seg1, GEV1 and Corr1 are for the first condition / file, GFP2, Dis2 etc for the second condition / file, and so on:

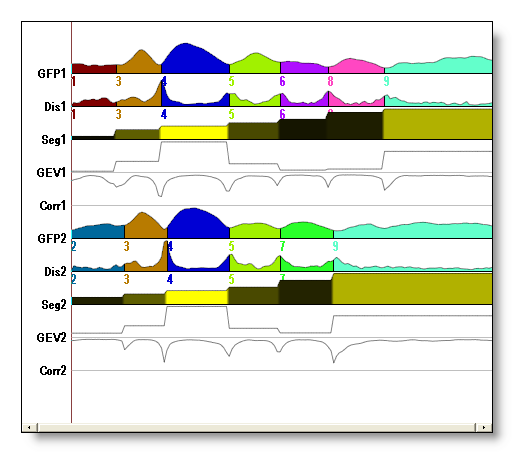
The coloring schemes used are the following:
-
For the GFP and Dis tracks, a discrete color is assigned according to the value of the labeling (contained in the Seg track). The colors are choosen to be the "furthest" from each others. They also depend on the maximum number of clusters, so that the color of segment 3 (f.ex.) in two different segmentations will look different.
-
For the Seg track, a proportional coloring based on the GEV (the following track, by the way) is used. The higher the GEV, the brighter the segment (from black to yellow).
Summary of segmentations
The .error.data file generated at the end of the Segmentation shows different error measures across the specified range of clusters. Its purpose is to help decide which is the optimal number of clusters, based on these measures.
It contains the following tracks, with the horizontal axis ranging from 1 to the max number of clusters:
-
Clust: the number of clusters from the mathematical clustering process
-
Maps: the final number of maps / segments
after the temporal processings
(if any)
-
GEV: the
Global
Explained Variance
of the whole segmentation
-
Gamma
Silhouettes
Davies-Bouldin
Point Biserial
Dunn Robust
Krzanowsky-Lai Index : various error measures of clustering quality - Mean Criterion: the median of the 6 criteria above
-
Meta-Criterion:
the 7 criteria above merged into a synthetic criterion
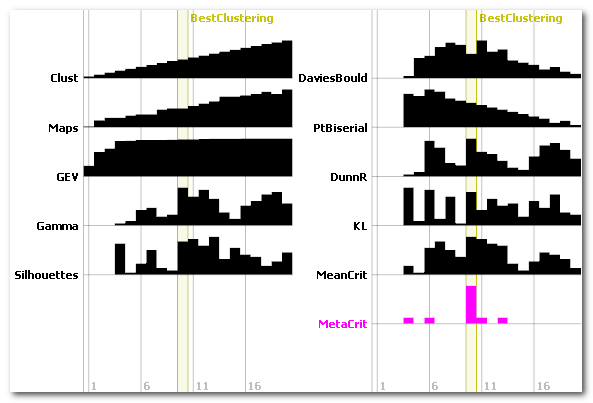
The display is also based on the EEG display, with just a few more options:
Menus
Options
Technical points
Number of clusters vs number of maps
Error measures
The Optimal number of clusters & Meta-Criterion
Summary of segmentations - Menu
Quite the same as the EEG Menus, with the following variations or additions:
Options menu
Open Segmentation(s) at cursor position
A shortcut to directly open the Segments files corresponding to where the cursor is located. If more than one position is selected, all the files are opened.
Summary of segmentations - Technical points
Number of Clusters vs number of Maps
There is a semantic distinction done here between the number of clusters and the number of segments:
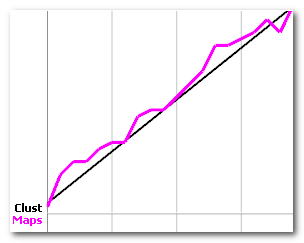
- The number of clusters is the input given to the clustering, the range specified by the user . It always shows up a straight line, of slope 1.
-
The
number of segments is the final number of
clusters after the optional temporal post-processing
. These
options could create more clusters, as per the
Sequentialization, or
delete some, as per the
Reject Small Segments
.
Without any post-processing, clusters and segments are totally equivalent.
Below we can see the number of clusters (black line) vs. the number of segments (violet line), showing that the temporal post-processing did alter the number of clusters:
Error measures
The Global Explained Variance (GEV) is a global measure of the quality of a given segmentation. It converges asymptotically toward 1 (perfect segmentation) as the number of clusters increases. Note that this value of 1 can only be reached if the number of clusters is equal to the number of time frames.
The other measures are explained here .